April data from payment services provider Cass Information Systems showed optimism around “seasonal improvement in May” but noted the year-over-year (y/y) comps will remain depressed going forward.
The shipments component of the Cass Freight Index was down 2.4% y/y in April and 1.3% lower on a seasonally adjusted basis than in March. The sequential decline during the month followed a 3.8% drop in March.
| April 2023 | y/y | 2-year | m/m | m/m (SA) |
| Shipments | -2.4% | -2.9% | -1.0% | -1.3% |
| Expenditures | -14.0% | 12.3% | -2.1% | -4.0% |
| TL Linehaul Index | -12.3% | 0.1% | -0.8% | NM |
The report published Monday said warm weather in the first two months of the year likely pulled forward shipments that would have normally been moved in March and April. However, recent seasonal improvement in other industry data sets was noted.
“Several higher frequency freight data series started April very soft and improved through the month and into May,” said ACT Research’s Tim Denoyer. “This augers toward at least a seasonal improvement in May, though the y/y decline may still worsen on a tough comp against inventory building a year ago.”
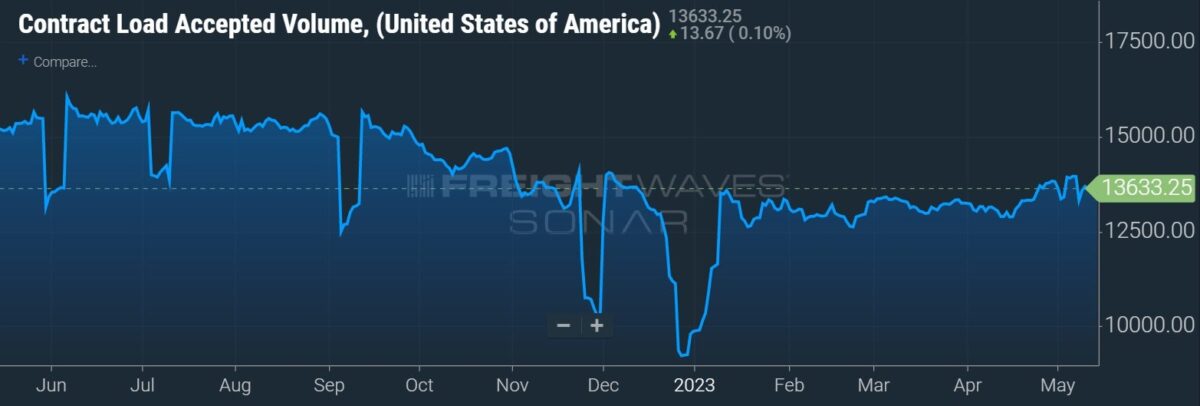
A modest step higher in loads under contract has been seen in FreightWaves data. The Contract Load Accepted Volume Index (SONAR: CLAV.USA) shows an increase in volumes in the latter part of April and into May.

“Declining real retail sales trends and ongoing destocking remain the primary headwinds to freight volumes, but dynamics are shifting as real incomes are improving, and the worst of the destock is most likely in the rearview,” Denoyer added.
Cass’ shipments index was also down on a two-year-stacked comparison for a second straight month in April, following 17 consecutive increases.
Assuming normal seasonal trends moving forward, y/y shipments are expected to be between 1% and 3% lower in the coming months.
Cass’ expenditures subindex, which captures the total amount spent moving freight, fell 14% y/y in April. The data set includes diesel fuel, which was off more than 20% y/y on average during the month. The subindex was also down 4% seasonally adjusted from March, a fifth straight sequential decline.
After a run-up of 38% in 2021 and a 23% increase last year, the index is expected to decline 12% this year.
With volumes off 1.3% and total costs down 4% sequentially (both seasonally adjusted), the assumption is actual freight rates across the platform were down 2.7% from March (down 11.9% y/y).
Cass’ linehaul index for truckload shipments, which measures linehaul rates without fuel and accessorial charges, dropped 12.3% y/y in April. Rates from both spot and contracted loads are included in the data set. The linehaul index was down 0.8% from March, the 11th consecutive sequential decline.

Truckload rates remain under pressure as freight demand remains tepid and carriers continue to stay in business longer than many predicted entering the year.
However, a Thursday report from fleet management and automation provider Motive showed the number of TL carriers is contracting. So far this year, carrier contractions have happened in all regions of the country, with the south leading the way, down 5%. States with the largest increases during the pandemic, such as Georgia, Florida and Texas, have seen the biggest declines.
“However, the fall across the overall market has not been precipitous, indicating the market may be moving toward more stability,” that report said. It showed new fleets continued to be added in April but at a slower pace. New company formations were down 17% sequentially from March.
Denoyer estimates DOT operating authorities have been declining over the last seven months. He also pointed to long-haul trucking jobs, which declined 1% sequentially in the first quarter. He said if current trends hold, the jobs data will turn negative y/y by June.
“But after a long soft patch, we see the U.S. freight transportation industry on the verge of a new cycle as we begin to transition from the bottoming phase into the early phase of the freight cycle in the months to come,” Denoyer said.
More FreightWaves articles by Todd Maiden
NTI rebounds as DOT week begins
Future of Supply Chain
JUNE 21-22, 2023 • CLEVELAND, OH • IN-PERSON EVENT
The greatest minds in the transportation, logistics and supply chain industries will share insights, predict future trends and showcase emerging technology the FreightWaves way–with engaging discussions, rapid-fire demos, interactive sponsor kiosks and more.
[ad_2]
Source link


