[ad_1]
Freight shipments and expenditures continued to fall in January, according to data compiled in the Cass Freight Index.
The Thursday report showed shipments were down 7.6% year over year (y/y) during the month and were 3.5% lower than in December. Adjusting for seasonality, shipments were flat with the prior month. The index stood at the lowest level since July 2020, the early days of the pandemic.
Inclement weather negatively impacted freight demand during January, meaning shipments would have likely been up sequentially in a normal year.
“Freight transportation is, of course, an outdoor sport, and it’s tough to say with precision if this January was worse than most, but if so, the underlying trend in freight improved in January,” the report read.
The shipments index was off 5.5% last year after seeing a slight increase in 2022. Normal seasonal trends for the rest of February imply the data set will be off 6% y/y. However, the report calls for a positive inflection at some point during the year.
“The acceleration in real disposable incomes, supported by surprisingly sharp disinflation and the ongoing strong labor market, suggest freight demand fundamentals will improve in 2024,” the report said.
| January 2024 | y/y | 2-year | m/m | m/m (SA) |
| Shipments | -7.6% | -3.6% | -3.5% | 0.0% |
| Expenditures | -24.3% | -23.0% | -4.0% | -2.5% |
| TL Linehaul Index | -5.9% | -11.1% | -0.6% | NM |
The freight expenditures subindex, which measures all dollars spent on freight (including fuel surcharges and accessorials), fell 24.3% y/y and was down 4% from December (down 2.5% seasonally adjusted). The index was down 19% y/y last year and is expected to be off 16% in the first half of 2024, which is 200 basis points worse than the forecast one month ago.
Netting the decline in shipments from the decline in expenditures implies actual freight rates were down 18.1% y/y in the month but down just 0.4% sequentially.
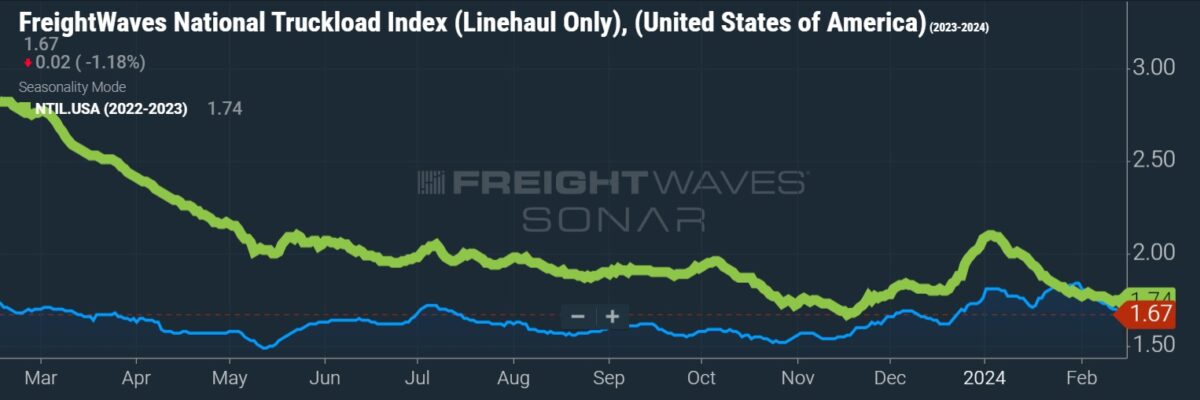
Cass’ TL linehaul index was down 5.9% y/y and 0.6% from December. The data set excludes changes in fuel and accessorial charges and captures changes in both spot and contract rates. The y/y decline was the smallest in a year. While the index hit a new cycle low, it has moved within a 1% band for the past eight months.

Carrier exits totaled 3,707 in January, which was 20% lower than December’s exit rate, according to data from fleet solutions provider Motive. New registrations were up 22% sequentially to 7,938 (down 26% y/y). Truck visits to the warehouses of the top 50 U.S. retailers were 2% higher y/y.
Cass’ truckload and less-than-truckload freight mix data shows LTL mix is on the rise, indicating a tighter freight market. “Directionally, this suggests the rebalancing is nearing completion,” the report said.
“While trucking demand remains soft overall, rising import and intermodal trends are key leading indicators of a recovery in trucking this year,” the report said. “Global ocean shipping disruptions will likely add to U.S. freight movements in 2024 as shippers seek to buffer safety stocks.”
Data used in the Cass indexes is derived from freight bills paid by Cass (NASDAQ: CASS), a provider of payment management solutions. Cass processes $44 billion in freight payables annually on behalf of customers.
More FreightWaves articles by Todd Maiden
[ad_2]
Source link


