The double-digit declines keep piling up for container shipping.
The Port of Long Beach said Friday that April imports fell 22% from the year before. Taiwanese ocean carriers Evergreen and Yang Ming reported that first-quarter profits plunged 95% and 94% year-on-year (y/y), respectively. South Korean carrier HMM said Monday that its first-quarter net income sank 91% y/y.
The prior week, Maersk reported a 66% y/y fall in Q1 net income on a 37% decline in freight rates. Hapag-Lloyd reported a 57% y/y drop in net income as its rates fell 28%.
The container shipping industry is awash in double-digit declines because the numbers a year ago were historically high.
Big numbers make for eyeball-grabbing headlines, both on the way up and down. Market reporters scour their thesauri for exciting new ways to say “increase” and “decrease.” But what double-digit percentages actually mean depends on the starting point.
For container shipping, percentages to date show a huge drop from best-in-history profits to more modest profits and from unprecedented, off-the-charts volumes to normal volumes.
Industry yet to ‘lap’ records
The drumbeat of attention-getting y/y declines is far from over.
Earnings and average rates (including both contract and spot) of most ocean carriers didn’t peak until Q3 2022. Import volumes to the West Coast ports didn’t start falling until June 2022. Volumes to East Coast ports kept rising until August.
According to Container Trades Statistics, global volumes peaked last May but didn’t fall sharply until September. The Harpex Index, which measures container-ship charter rates, remained near its highs until August.
The double-digit drops will vanish when the container shipping industry “laps” these dates later in 2023. In some cases, percentages may turn positive.
Comparisons to pre-COVID numbers
There is no historical precedent for the 2021-2022 container shipping boom — an anomaly caused by the pandemic. However, there is precedent in commodity shipping: the 2003-2008 boom in dry bulk and tanker shipping caused by another one-off event — China’s rapid ascent in world trade.
Hedge funds and private-equity funds made disastrous market bets in the years following that earlier supercycle by including the inflated returns of 2003-2008 in their forward expectations for “normal” market conditions. The lesson learned after massive losses on commodity shipping investments in the early teens: Focus less on the outlier period and more on what happened before and after.
Doing so in container shipping tells a different story. Long Beach’s April’s import volumes — 313,444 twenty-foot equivalent units — were up 58,474 TEUs, or 23%, from the recent low in February. This April’s imports were flat versus imports in April 2019 and 2018 (minus 1.4% and plus 0.3%, respectively).
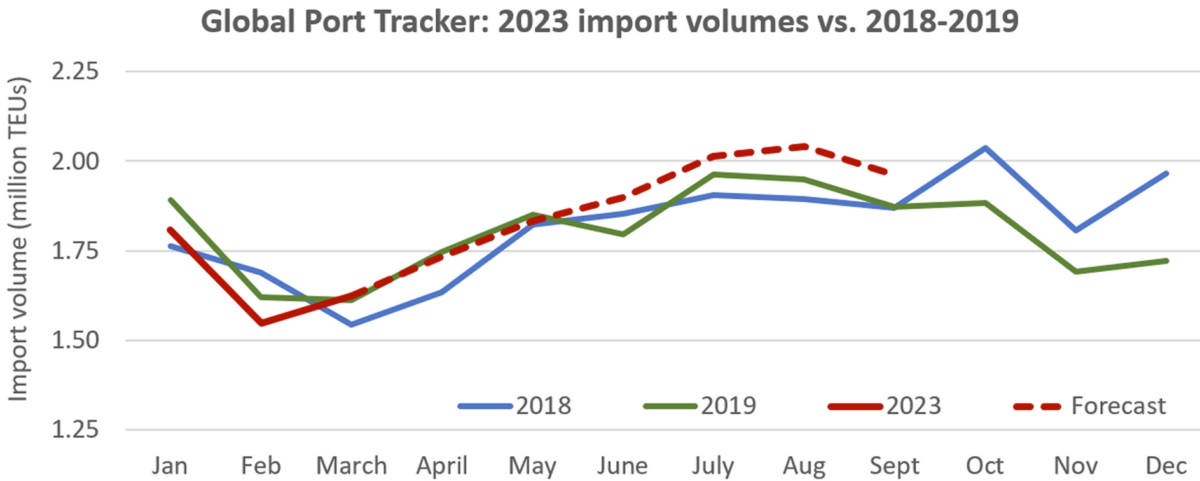
Global Port Tracker, produced by the National Retail Federation (NRF) and Hackett Associates, shows U.S. imports this year trending closely with 2018-2019 levels. The latest Port Tracker forecast for June-September is slightly above pre-pandemic levels.

HMM posted net income of $213 million for Q1 2023. In Q1 2019, pre-COVID, it suffered a $149 million loss. Evergreen booked net income of $164 million in the first quarter of this year, nine times its net income in Q1 2019. Maersk’s average freight rate, including the positive effect of legacy contracts, was 51% higher in Q1 2023 than Q1 2019. Hapag-Lloyd’s was 85% higher.
The Harpex charter-rate index is up 17% from the low hit in March. It’s now just over double its level in mid-May 2019.
Even spot rates — which have fallen much faster than charter rates, liner earnings and port volumes — are still up on a global basis versus pre-COVID. The Drewry World Container Index global composite is down 77% y/y but 23% higher than the 2019 average.

What happened after 2003-2008 boom?
Container lines and cargo shippers had never seen anything like the 2021-2022 rate spike. But the violent market swing was very familiar to commodity shipping veterans who amassed fortunes from 2003 to 2008.
Values for 5-year old Capesize (dry bulk vessels with capacity of around 180,000 deadweight tons or DWT) quintupled, from $30 million in 2003 to over $150 million in 2008. Then they went off a cliff and sank back to $40 million by 2009. Values for 5-year-old Panamaxes (65,000-90,000 DWT) rose six-fold from $15 million to $90 million, then suddenly crashed to $30 million.

Values of 5-year-old very large crude carriers (tankers that carry 2 million barrels) jumped from $60 million to $165 million. Then they sank back to $80 million. Values of 5-year-old Suezmaxes (tankers that carry 1 million barrels) soared from $40 million to $105 million, then fell to $60 million.

A new wave of large investors entered shipping after the global financial crisis, betting on the “reversion to the mean” thesis. They looked at the 10-year average of rates and asset values and assumed they would revert to the mean. The fatal flaw in this thinking: The prior 10 years included a one-off boom that skewed the mean too high to revert to.
“I don’t think their analysis was all that complicated,” said AMA Capital Partners CEO Paul Leand during a Marine Money conference in 2013.
“I think they looked at rates and values in 2008, they looked at where they are today and they looked at the 10-year average including 2007 and 2008 and they said: ‘It’s going up. It’s a great opportunity. We’ve got $20 billion to invest. Let’s throw $500 million into shipping.’”
At the same conference, Herman Hildan, then a shipping analyst at RS Platou, advised a different approach: Use a 20-year rate average that excludes the peak earning years of 2007 and 2008 to curb the boom years’ bias.
A decade after that debate, the same question of how to gauge the market in the aftermath of a one-off boom — and how much to focus on the outlier years — has arisen yet again, this time in container shipping.
Click for more articles by Greg Miller
Related articles:
Future of Supply Chain
JUNE 21-22, 2023 • CLEVELAND, OH • IN-PERSON EVENT
The greatest minds in the transportation, logistics and supply chain industries will share insights, predict future trends and showcase emerging technology the FreightWaves way–with engaging discussions, rapid-fire demos, interactive sponsor kiosks and more.
[ad_2]
Source link


