[ad_1]
The benchmark diesel price used for most fuel surcharges did something this week that had not happened since April 2021: nothing.
For the second consecutive week, the Department of Energy/Energy Information Administration posted a price of $3.806 a gallon for the closely watched number.
Diesel futures markets had been trending higher for the past two weeks, pulling up wholesale prices with it. That suggested that after last week’s 3.9-cent increase, just the third in 23 weeks, retail diesel markets might be ready to reverse their long decline.
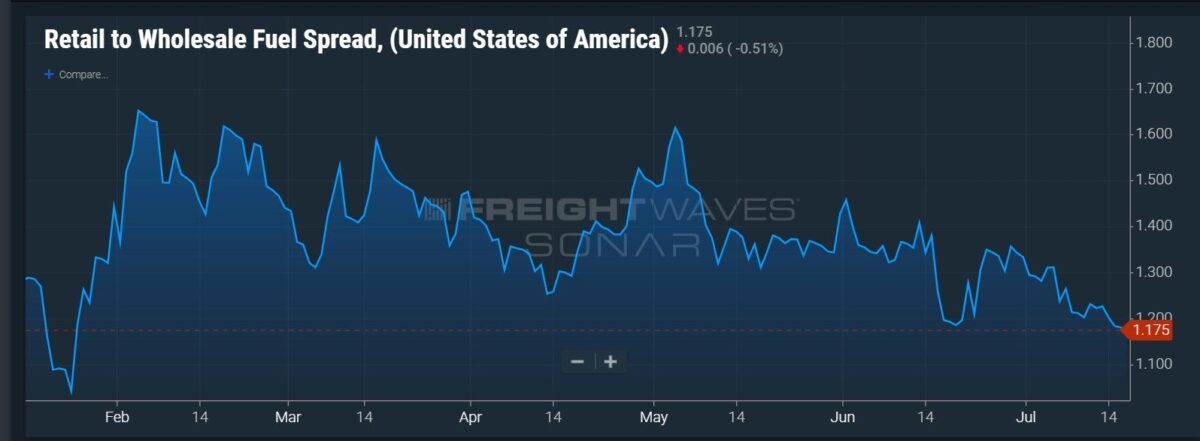
Also lending a hand to that argument: The retail diesel price relative to the wholesale price, as measured by the FUELS.USA spread in SONAR, declined Monday to its lowest level since January, coming in at $1.175 a gallon. But retailers appear not to be lifting their prices yet in reaction to higher wholesale numbers, resulting in that spread continuing to stay as low as it has been all year.

Diesel markets will be looking this week to see if an eye-opening number from last week was a one-time aberration or whether it reflects a significant downturn in demand that may last.
The weekly EIA statistical report estimates demand under the heading of “Product Supplied.” And that figure for nonjet fuel distillates, which is roughly 90% diesel, came in at 2.969 million barrels a day. (Jet fuel is a distillate but statistics on its supply, demand and inventories are separate in the EIA report.)
To illustrate how low that number is, product supplied for distillate in the past 10 years has been less than 3 million b/d only seven times. Six of those were around the Christmas and New Year’s holidays. The other was near the start of the pandemic.
Average product supplied for the first weekly report of July over the past seven years is 3.78 million b/d. The data reported last week would have been for the week that included July Fourth, but the first weekly report for July virtually always does as well. That is what made last week’s number stick out, and why the data that comes in at this week — the report is released Wednesday — will be so closely watched.
Oil markets are always the battleground for bulls and bears, but the differences in outlook appear particularly stark in recent weeks.
The bull case can be found in the balance numbers provided by organizations such as the International Energy Agency, which sees tightening supply through the rest of the year, driven by promised cuts implemented by the OPEC+ nations and the probability that rising U.S. output may be running out of steam.
The bear case was best summed up in a Bloomberg report that quoted industry legend Ed Morse, the global head of commodity strategy at Citi.
The report quoted Morse as saying “the bulls got it all wrong.” He cited as bearish factors a recovery in China that by most accounts has been tepid; a lingering recession in Europe (as illustrated in this Wall Street Journal story that declares in its headline “Europeans are becoming poorer”); and Morse’s view that “we still don’t know if the U.S. will have a hard landing.”
There have been other bearish arguments made on the back of production from several nations that aren’t sticking to the script of lower output. The Wall Street Journal reported last week that Iranian crude exports of about 1.6 million b/d are the highest in five years and double last year’s level.
There are even reports that Chinese crude production, never a significant factor and a number that has been stuck at or below 4 million b/d for years, is starting to increase.
In a note to investors, the bull case was spelled out by HDI Research. It cited the deficit of supply to demand cited by the IEA and others, stagnant U.S. production, and the cuts announced by Saudi Arabia, Russia and OPEC+ that S&P Global Commodity Insights reported last week had reduced output from OPEC+ in June to 41.34 million b/d, down from about 42 million b/d in April but virtually unchanged from May.
Oil markets have been reacting more to the bullish case, at least until the past few days. World crude benchmark Brent settled at $72.26 a barrel on June 27 and climbed to a settlement of $81.36 Thursday. But two consecutive days of decline pulled it down to $78.50 Monday.
Ultra low sulfur diesel on the CME commodity exchange has closely tracked the movements in Brent. The spread between Brent and ULSD has been mostly steady near 69 cents a gallon for the past several trading days. On an outright basis, ULSD has tracked the movements in Brent, settling at $2.4794 a gallon on July 6, rising as high as a settlement of $2.6104 on Thursday and then moving down Monday to $2.5642.
More articles by John Kingston
Monthly Cass report suggests freight market bottom may be near
E2open execs tout year-over-year subscription EBITDA growth
Truck transportation employment moves up and down in the same month
[ad_2]
Source link


